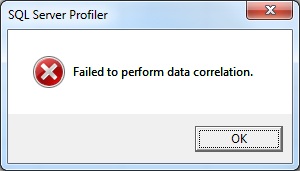
While working with PerfMon data recently I ran into an interesting error when I tried to view it overlayed against a Trace file. If you’re not familiar with that process, I recommend Brad McGehee’s article Correlating SQL Server Profiler with Performance Monitor. I had opened a Trace file and selected a PerfMon file to import. I selected about five counters and soon after the import started, then I got the error message:
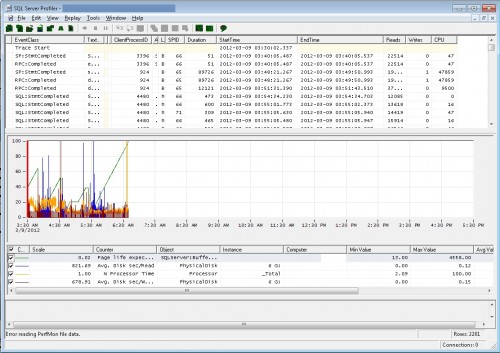
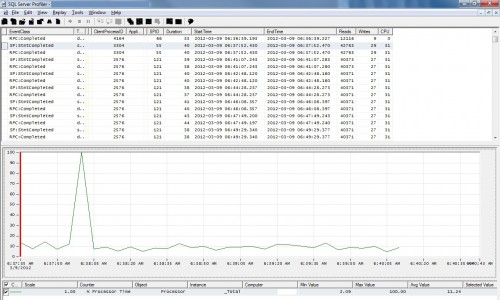
And the PerfMon data looked like this in Profiler:
I hadn’t seen that message before and the output was then somewhat useless since I couldn’t compare the PerfMon data with Trace in that format after 6:30 AM. I took another set of PerfMon and Trace files and tried to the import again. Same message. I decided to dig in and see if I could figure it out.
I loaded a third set of PerfMon and Trace, same thing. I checked to see if the data cut off at the same time in each trace and it didn’t.
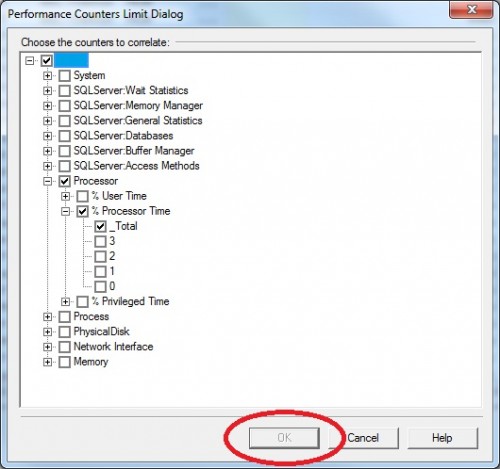
Then I tried to load just one counter at a time. I started with %Processor Time_Total, I have no idea why I picked that counter first, but when I went to click OK, it was grayed out:
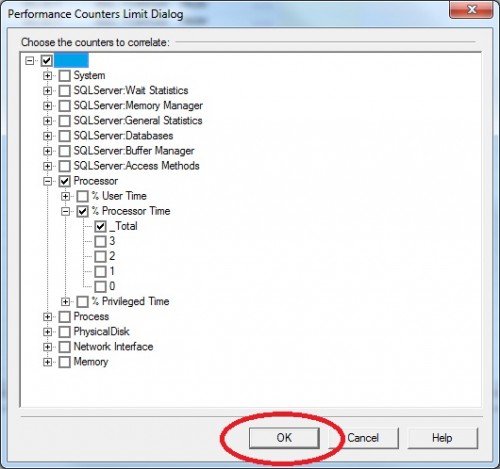
Interesting. I selected another counter and the OK button became available so I selected OK to import the data and got the error message again. I started over. After I selected the %Processor Time_Total counter, I selected another counter, then unselected it. The OK button was now available:
I imported the data, and I got the error again. Then I zoomed in on the PerfMon graph to see the timestamp for when it stopped:
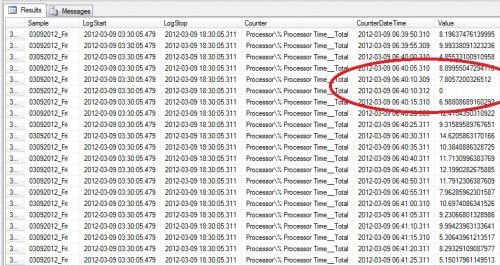
At that point, I knew the issue was with data somewhere between 6:40:05 and 6:40:20. Next I read the data directly from the PerfMon trace, which I had loaded into a database table using relog. I found this:
There were two samples taken at 6:40:10, three milliseconds apart. I have to conclude that for some reason, that causes the import to fail, because when I checked the other files, I found the same thing: multiple entries for the same second, taken milliseconds apart.
There is a fix for this. I used the relog utility to split out the original file into two files, excluding the data sampled at 6:40:10, and then merged the files back into one.
separate the file:
relog PerfMon_20120309.blg -b 03/09/2012 03:35:00 -e 03/09/2012 06:40:10 -o PartI.blg
relog PerfMon_20120309.blg -b 03/09/2012 06:40:15 -e 03/09/2012 18:35:00 -o Part2.blg
merge files:
relog Part1.blg Part2.blg -o PerfMon_20120309_Fixed.blg
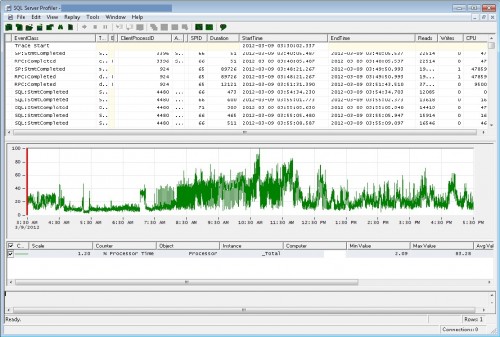
Not elegant, but possible. Once I did that, I could import all the data for % Processor Time_Total:
Even though I have a way to fix this problem, this is not a solution. The solution is to not have bad data to begin with. If I were consistently working with this customer’s data, I would dig in and try to figure out what was causing the bad sampling. It’s not likely that I will have the opportunity to do that, but should I run into this problem again, at least I have a quick fix, and maybe I will have the time then to figure out what’s really going on.

